
There is no denying that 2016 was a tumultuous year. After a surprise victory in the U.S. Presidential election, the world waits to see how the new Trump administration’s agenda will play out. Against this backdrop of geopolitical chaos and uncertainty, the past 12 months have been marked by a parallel set of economic forces at work that have combined to create significant volatility in China’s supply chain, which in turn, is creating pricing uncertainty for point of purchase displays as we head into 2017. So, what exactly is going on in China and how might it impact your POP display projects in 2017?
The main source of supply chain chaos in China over the last 12 months is raw material price increases. Metal is one of the primary materials used in POP displays, and the price of steel in China has been particularly volatile over the last 12 months. The chart below shows the changes in steel prices (RMB/ton) in China for the first 11 months of the year. The price of steel increased about 60% during the first 4 months of 2016 before declining by about 28% in May. However, between May and November there has been a more gradual increase of nearly 50% in steel prices. The price of steel increased 58% between March and November and 44%-50% between January and November.

Although not used as commonly in POP displays, aluminum prices have also increased significantly. Between April and November of 2016, the price per ton of aluminum increased by 40% as shown in the chart below.

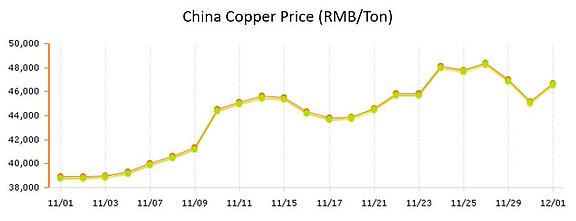
Prices in China of finished materials like copper have exhibited greater stability throughout 2016 but have shown large increases as of late. The chart below shows that the price of copper increased 20% in November alone.
Plastic is also a key raw material input for POP displays. The chart below shows the price (RMB/ton) of 3 different types of plastic (PP in yellow, PE in blue, and ABS in red) from January through November of 2016. While plastic prices fluctuated within a narrower range throughout the year compared to other raw materials like steel, all 3 types of plastic have increased during the 4th quarter of 2016. The most notable price increase has been in ABS plastic which has increased about 40% between June and November.

In additional to traditional raw materials used to make displays, there have been big increases in the price of paper between July and November of 2016, which impacts the cost of boxes and packing materials. The first chart below shows the price increase for 5 major color box materials from one POP display factory in China. The price increase from July to November 2016 was in the 25% to 27% range.

Similarly, the chart below shows a 40%-50% price increase for 9 different types of paper material from one major paper supplier in China between July and November of 2016. Most factories in China are struggling not only with the price increases but also with the supply of boxes and packing materials as many paper factories have closed, which has impacted availability, particularly as we approach Chinese New Year. In December 2016 alone, many factories have experienced a 50% increase in the cost of packing materials, with some major packing parts increasing by as much as 80%.

As with paper factories, a number of powder coating factories in China have also closed due to more stringent environmental regulations imposed by the government. This has impacted the price and availability (timeliness) of powder coating.
These raw material cost increases have put financial pressure on many POP display factories in China. Undercapitalized factories are suffering in particular since many raw material suppliers are demanding cash up front. There is always a big push for cash among Chinese factories leading into Chinese New Year, but the raw material price increases have further impacted factory cash flow throughout the supply chain in China.
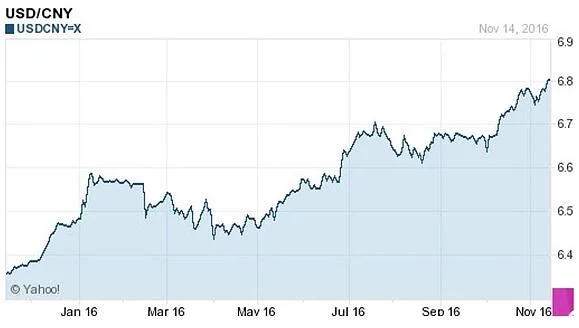
Finally, in addition to the inflationary raw material trends outlined above, the strengthening of the U.S. dollar (which is at a 14-year high) in 2016 against all major world currencies, including China’s RMB, is impacting global trade economics. The chart below shows the devaluation of the RMB relative to the U.S. Dollar from January (about 6.2 RMB to the dollar) to November (about 6.8 RMB to the dollar)- about a 10% change. The RMB devaluation has helped Chinese factories but not enough to offset the large increases in material costs.
It’s difficult to predict what will happen in 2017, but most experts believe that the trends in raw material prices will continue at least until Chinese New Year and likely into March. We would expect prices to normalize after that since we don’t believe the level of price increases we have been seeing are sustainable over the long term. However, for 2017 POP display planning purposes, it is advisable to assume that prices will be up relative to the levels we experienced in 2016.

Jim Hollen is the owner and President of RICH LTD. (www.richltd.com), a 35+ year-old California-based point-of-purchase display, retail store fixture, and merchandising solutions firm which has been named among the Top 50 U.S. POP display companies for 9 consecutive years. A former management consultant with McKinsey & Co. and graduate of Stanford Business School, Jim Hollen has served more than 3000 brands and retailers over more than 20 years and has authored nearly 500 blogs and e-Books on a wide range of topics related to POP displays, store fixtures, and retail merchandising.
Jim has been to China more than 50 times and has worked directly with more than 30 factories in Asia across a broad range of material categories, including metal, wood, acrylic, injection molded and vacuum formed plastic, corrugated, glass, LED lighting, digital media player, and more. Jim Hollen also oversees RICH LTD.’s domestic manufacturing operation and has experience manufacturing, sourcing, and importing from numerous Asian countries as well as Vietnam and Mexico.
His experience working with brands and retailers spans more than 25 industries such as food and beverage, apparel, consumer electronics, cosmetics/beauty, sporting goods, automotive, pet, gifts and souvenirs, toys, wine and spirits, home improvement, jewelry, eyewear, footwear, consumer products, mass market retail, specialty retail, convenience stores, and numerous other product/retailer categories.